

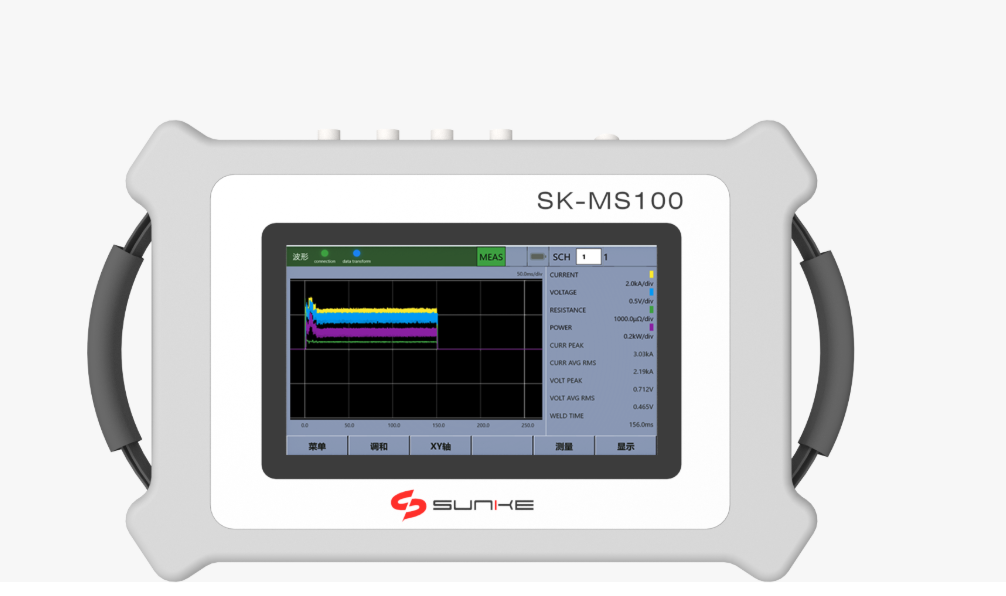
Problem: Monitors lie when you don’t check ’em
Look — your weld monitor’s supposed to be the truth-teller on the line, but over weeks and months it starts slippin’. You see false rejects, occasional weak nuggets, or a drift in recorded energy. Folks lean on resistance welding solutions and expect steady output, yet the machine readouts don’t always match what’s under the lens. I’ve seen this first-hand on Detroit automotive assembly plants where uptime and spot-weld integrity matter every minute. That mismatch’s the problem we gotta break down.
Why reliability fails — the real weak links
Quick list — no fluff: • Measurement drift from aging sensors and thermals; • Electrode wear changing contact resistance; • Poor grounding or cable degradation; • Software updates that alter signal processing; • Environmental swings — dust, temp, humidity. Each one alone can misreport weld energy, but together they bury pattern detection. You gotta know which fault you’re huntin’ for before you fix it.
Define reliable: what to measure, plain and clear
Don’t chase vague KPIs. Track measurable items that map to weld quality: weld current waveform, squeeze and weld force, electrode resistance, nugget collapse/expansion (when inspectable), and time-aligned energy. Add timestamped process logs and traceability back to the part. Use direct metrics — average current, peak current, area under curve (energy), force variance — then watch trends, not just snapshots.
How to assess long-term performance — a no-nonsense protocol
Run a solid cadence: baseline validation, routine checks, and failure-mode audits. Baseline: document sensor outputs against a physical standard after installation. Routine: sample results per shift or per production lot depending on volume. Audit: when trends pop, do destructive or metallurgical spot checks. Example checklist — calibrate sensors; verify tooling contact; compare monitor energy to handheld measurement; review software logs for filters that mask drift. Do this consistently and you’ll catch slow creep before it bites.
Tools and statistical tricks that actually help
Use SPC charts to spot shift and drift. Monitor Cpk for process capability where feasible. Capture raw waveforms for at least short windows so you can replay and compare. Flag outliers automatically but inspect them manually before adjusting limits. When you automate this, tie it into your MES so weld records sit with part IDs; that’s how you prove a fix worked. Where robots handle the job, integrate the process into your automated resistance welding setup so data flows from controller to archive without gaps.
Typical mistakes that cost time and trust
Don’t: replace monitors first; ignore electrode maintenance; trust vendor defaults; or change only thresholds instead of diagnosing root cause. Do: confirm mechanical consistency, keep tooling logs, and correlate monitor alarms with physical inspection. Fixing the wrong thing faster ain’t progress — it’s expensive noise.
Alternatives and trade-offs — short take
If monitors are unreliable despite good practice, options exist: upgrade sensor bandwidth for cleaner waveforms; add force transducers; introduce inline nondestructive testing; or increase inspection frequency. Each step ups cost and complexity. Pick based on failure impact: safety-critical or warranty-heavy parts justify heavier investment; low-risk welds can survive spot audits.
Wrap-up: keep it honest, keep it checked
Be real: reliability’s not a checkbox. It’s a routine — baseline right, monitor raw signals, watch trends, and fix root causes. When teams get precise about what they measure and how they validate, the monitor becomes a reliable partner. That’s the kind of straight-up value firms count on from Sunke, blending tools and data so your welds tell the truth and your line stays tight.